Is Your Digital Data Actually Closing Gaps? A 4-Question Diagnostic for Health Plan Operators
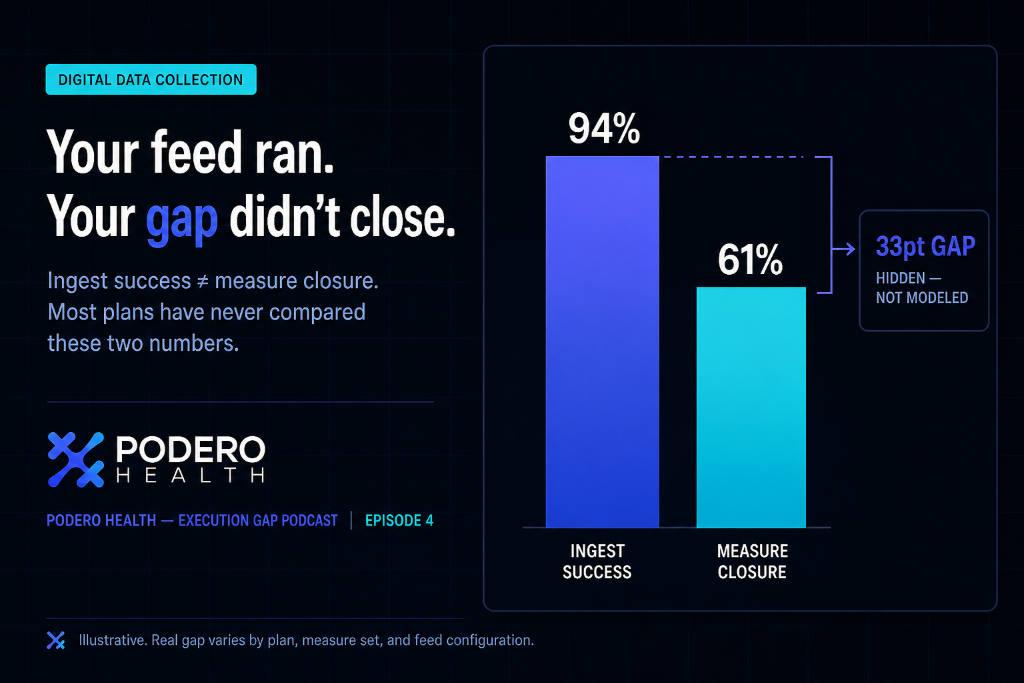
Covered in depth in Episode 4 of the Podero Health PodcastMost health plans I talk to are proud of their digital data infrastructure. EMR integrations in place. Lab feeds running. CCD exchange agreements signed. Feed dashboards showing high ingest success rates.
And then their Stars scores come back lower than their models predicted. And nobody can explain the gap.
The reason, almost every time, is this: plans are measuring data collection. They are not measuring data effectiveness. Those are not the same metric. And the difference between them is where Stars performance gets lost.
I've spent the last several months looking at this specific problem — where digital data collection succeeds at the record level and fails at the measure level — and I want to give you a diagnostic you can actually use. Four questions. If you can answer all four clearly, your digital data program is working. If you can't, you have a silent performance problem that won't announce itself until your next Stars cycle.
Before the diagnostic: understand what "silent failure" means
Chart retrieval fails loudly. When a chart doesn't arrive, someone knows — there's a chase list, an escalation, a visible gap in the workflow. Someone is accountable for the miss.
Digital data collection fails silently. The feed runs. The file lands. The record count is right. No alarm goes off. And the measure still doesn't close — because the data that arrived, while technically present, doesn't satisfy the specific clinical and coding requirements of the measure you're trying to close.
The failure lives between ingestion and abstraction. And most plans have no systematic visibility into that space.
That's what this diagnostic is designed to surface.
Question 1: What is your measure closure rate by data source — and how does it compare to your ingest success rate?
This is the foundational question. And it's the one most plans cannot answer without significant manual work.
Your ingest success rate tells you how many records landed in your system. Your measure closure rate by source tells you how many of those records actually produced a closed gap on a specific HEDIS measure.
Pull those two numbers side by side, by source — EMR feeds, lab feeds, CCD exchanges, claims. If your ingest success rate is 90%+ and your measure closure rate on those ingested records is meaningfully lower, you have a completeness problem. The data is arriving. It is not being used.
In my experience, the gap between these two numbers is larger than any plan has formally modeled — and it grows silently every time NCQA updates its value sets in annual technical specifications while feed agreements stay static.
If you don't have this comparison available, that's your answer. You're measuring the wrong thing.
Question 2: Does your abstraction logic validate against this year's NCQA value sets — or last year's?
This question makes people uncomfortable because the answer is often: we don't actually know.
NCQA updates its Value Set Directory annually. Measure specifications change. Codes get added, removed, and reclassified. A lab result that mapped cleanly to the numerator last measurement year may not map this year if the value set shifted and your abstraction logic wasn't updated in sync.
This is not a theoretical risk. It's a routine operational failure that produces a specific outcome: a member receives care that satisfies a measure, the data arrives digitally, and the measure still doesn't close because the code the provider or lab used isn't on NCQA's current approved list for that measure in that year.
The member thinks their gap is closed. Your system shows an ingested record. Your measure count disagrees with both.
The question to ask your abstraction team or vendor: when were our value set mappings last updated, and how do we validate they're current against this year's NCQA technical specifications? If that process isn't documented and on a defined refresh cycle, you have exposure you aren't modeling.
Question 3: When two data sources conflict on the same member and measure, what does your abstractor actually do?
NCQA requires plans to document their supplemental data methodology — including how conflicting sources are handled. Most plans have something written. The question is whether what's written is specific enough to be enforced consistently.
Here's the test: take three coders, give them the same conflicting record — an EMR showing a completed procedure and claims showing no corresponding billing — and see if they make the same decision. If they don't, your documented protocol isn't your actual process. Your coders' judgment is your process. And individual judgment, applied inconsistently across a production volume, is exactly what a HEDIS compliance audit is designed to find.
A source hierarchy that survives audit has three properties. It is specific enough that the same decision is made regardless of which coder handles the record. It accounts for every data source currently in use — not the sources you had when the document was written. And it gets reviewed and updated when any of those sources change.
If your current documentation hasn't been updated since your last feed agreement was signed, it's outdated.
Question 4: Are your digital feeds and manual chart retrieval running as one pipeline or two separate programs?
This is the operational question that matters most for the members who have the greatest impact on your Stars performance.
The members who are hardest to close — the ones with complex clinical histories, multiple providers, out-of-network specialists — are almost never fully covered by one clean data source. A lab result came in digitally, but the procedure note is in a paper chart. The EMR feed captured the encounter, but not the clinical detail that satisfies the measure. Claims show the service was billed, but the supporting documentation the abstractor needs doesn't exist in any digital feed.
Those members need digital data and targeted chart retrieval working together. The digital feed flags the gap and identifies what's missing. The chart retrieval fills the specific documentation gap. That coordination requires a shared data layer, a defined handoff protocol, and a timeline that allows both to happen before your submission window closes.
Plans that run retrieval and digital feeds as separate vendor programs — separate timelines, separate reporting, no shared data — miss these members systematically. Not occasionally. The members who fall through the gap between two siloed programs are disproportionately the members with the most open gaps and the most weight on your Stars rating.
What to do with your answers
If you answered all four questions clearly and confidently, your digital data program has stronger operational discipline than most. The risk is complacency — value sets change, feed agreements expire, new sources get added without triggering a protocol review.
If you couldn't answer one or more questions without significant uncertainty, the gap between your digital data investment and your digital data effectiveness is real. And it's showing up in your Stars score in a way that's nearly impossible to trace back to its origin after the fact.
The most important shift is a measurement one. Start tracking measure closure rate by data source alongside your ingest success rate. That comparison — run consistently, by measure, by source — will surface the specific failure points in your digital pipeline faster than any audit or vendor review.
Go Deeper
This article is based on Episode 4 of the Podero Health Podcast — The Data Feed Delusion: Why Digital Collection Fails Silently Where Chart Retrieval Fails Loudly. I cover the completeness illusion, feed sequencing failures, source conflict protocols, and where NCQA's DAV validation ends and your real exposure begins.
Listen to Episode 4See how Podero Health closes this gap operationally
If these four questions surfaced something worth a closer look at your plan, we'd like to show you what a single execution layer across data collection, abstraction, outreach, and submission looks like against your actual data.